
30
-5
5
15
25
-20
-15
-10
-5
0
5
10
0°
90°
180°
270°
Center of Runout
Top of Shaft
West-East
So
u
t
h
h
-
N
N
o
r
t
h
t
h
Runout Plot
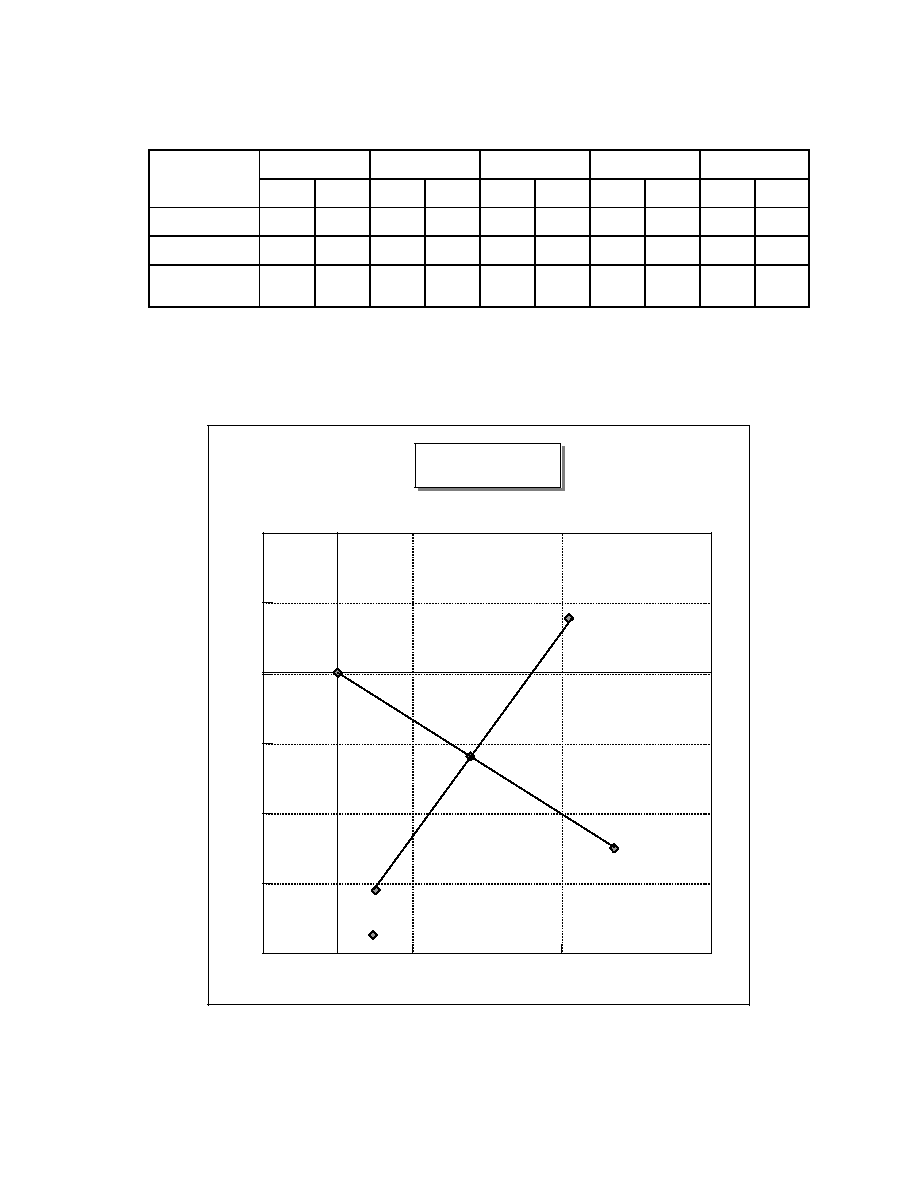
Figure 18.--Runout worksheet using dial indicators.
Runout Worksheet Using Dial Indicators
0
E
90
E
180
E
270
E
360
E
N
E
N
E
N
E
N
E
N
E
Bottom
0
0
4
16.5
-11.5
17.5
-14.5
2.5
1
0
Top
0
0
0
1
1
-1
1
0
1
0
Corrected
(Bottom - Top)
(Bottom - Top)
0
0
4
15.5
-12.5
18.5
-15.5
25
0
0